
UCLA Heat Maps.
https://uclaheatmaps.org/
About the resource
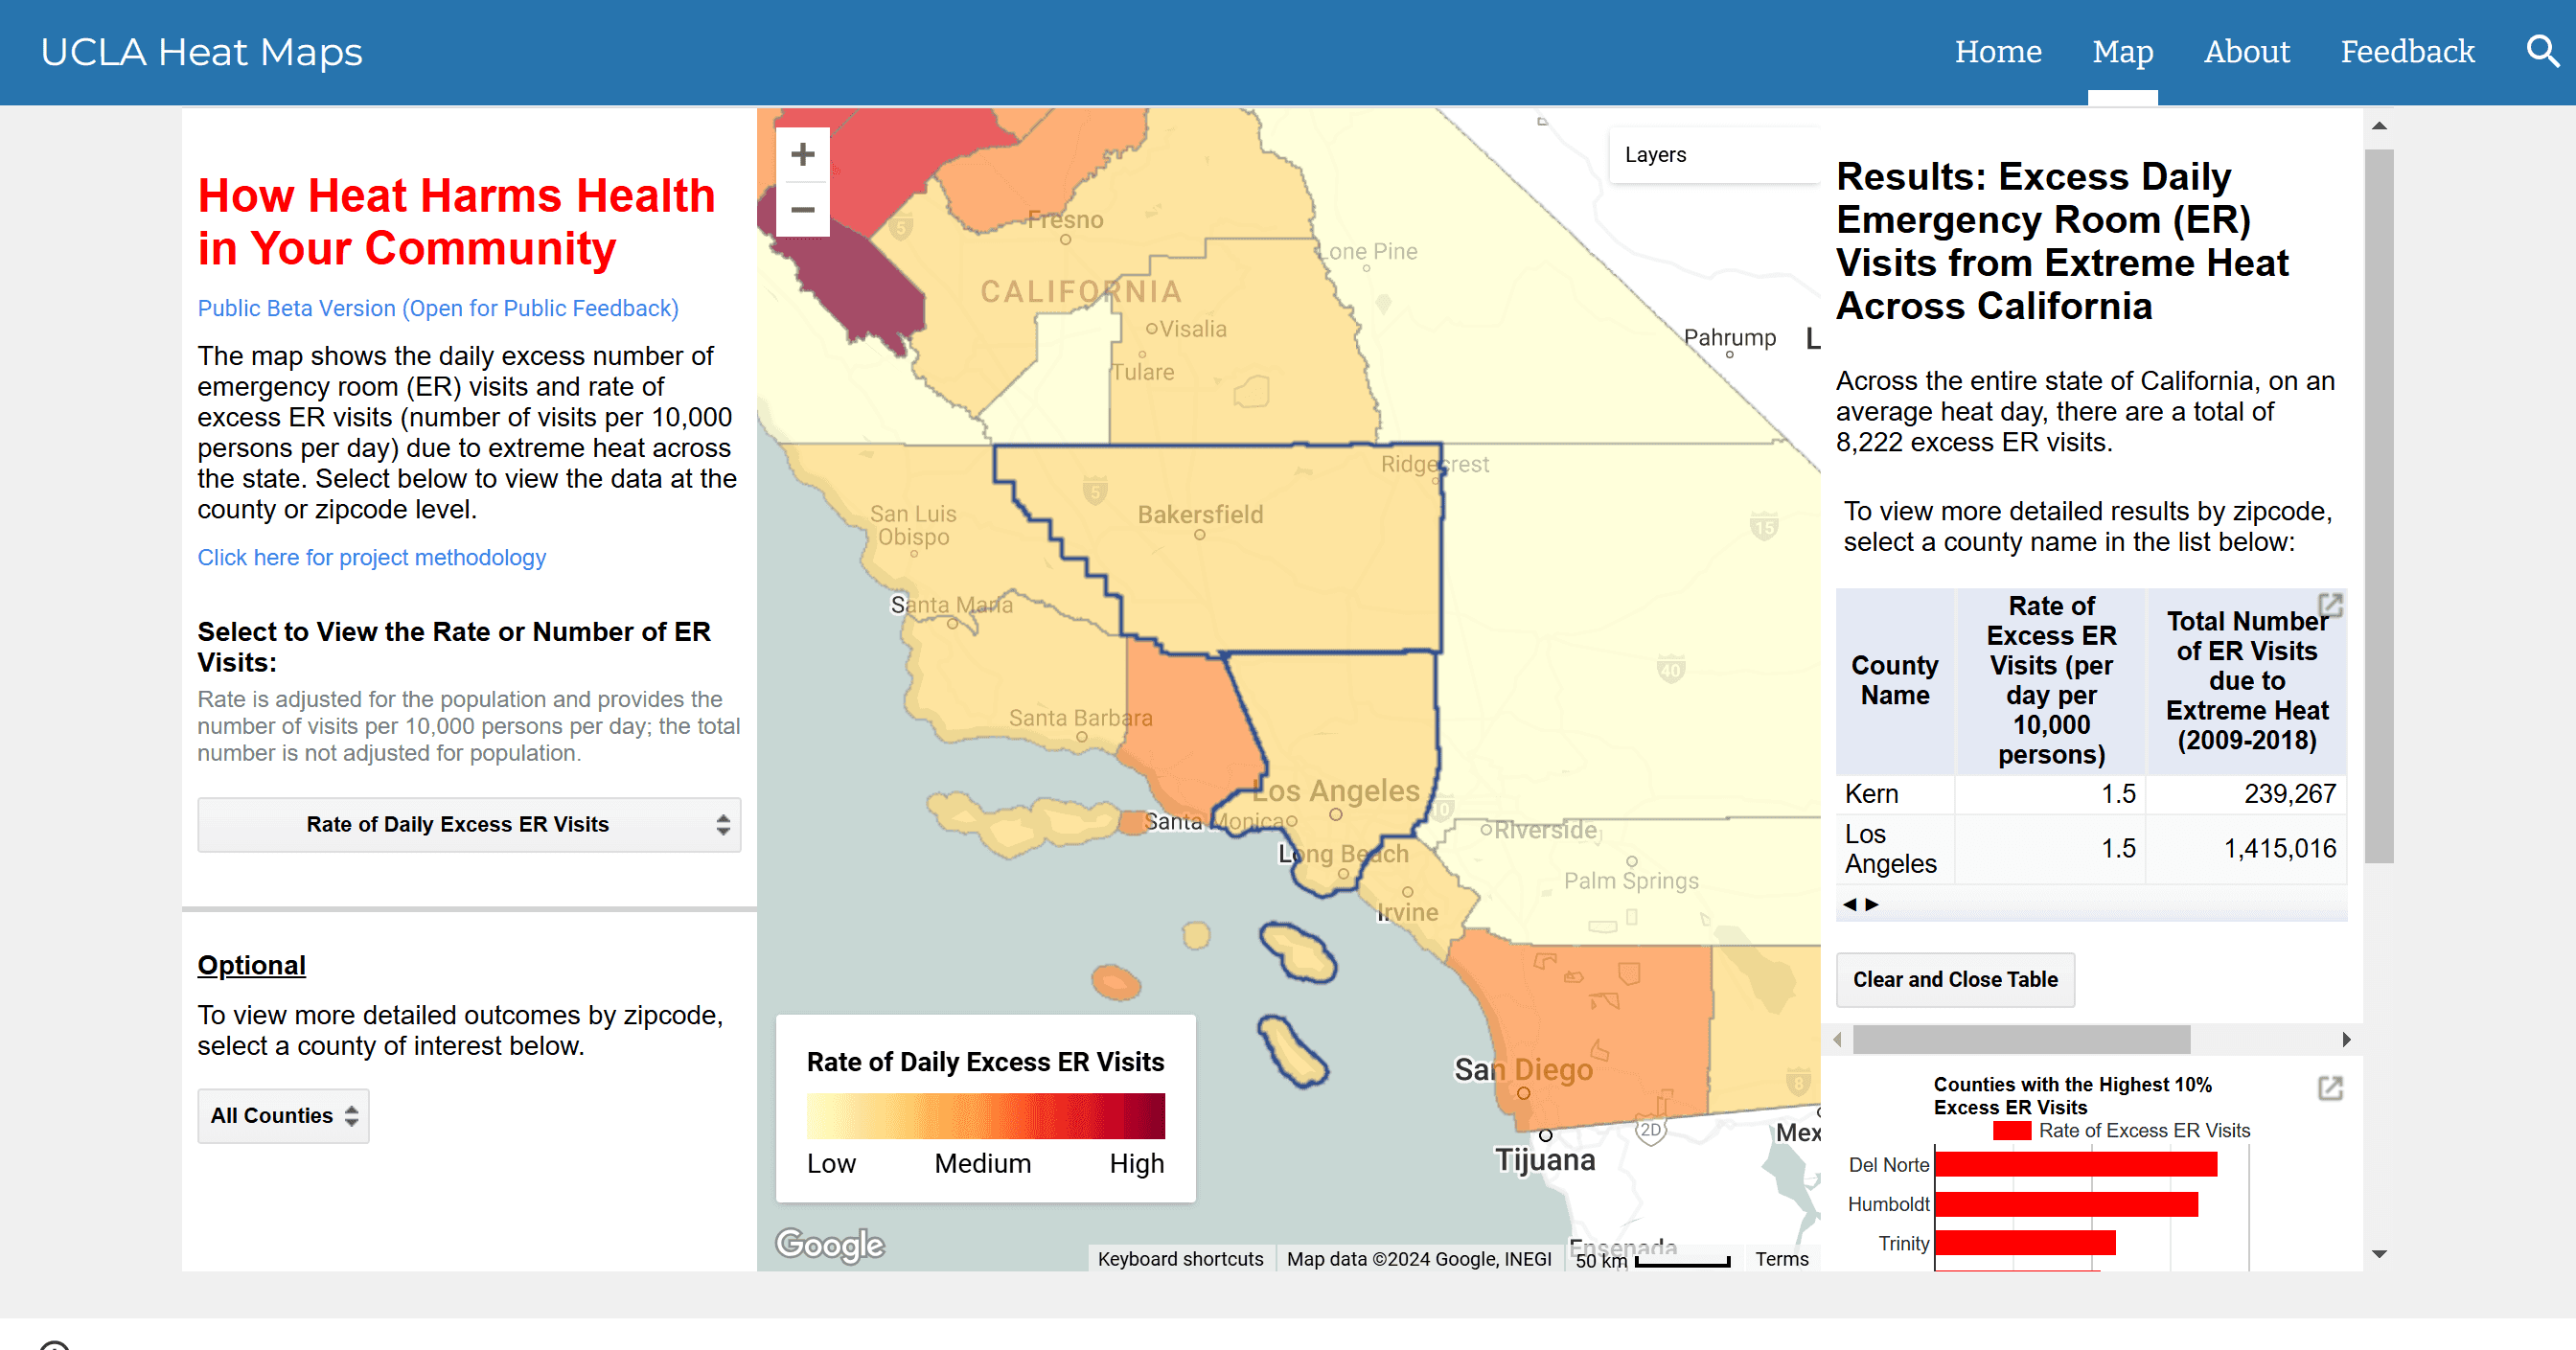
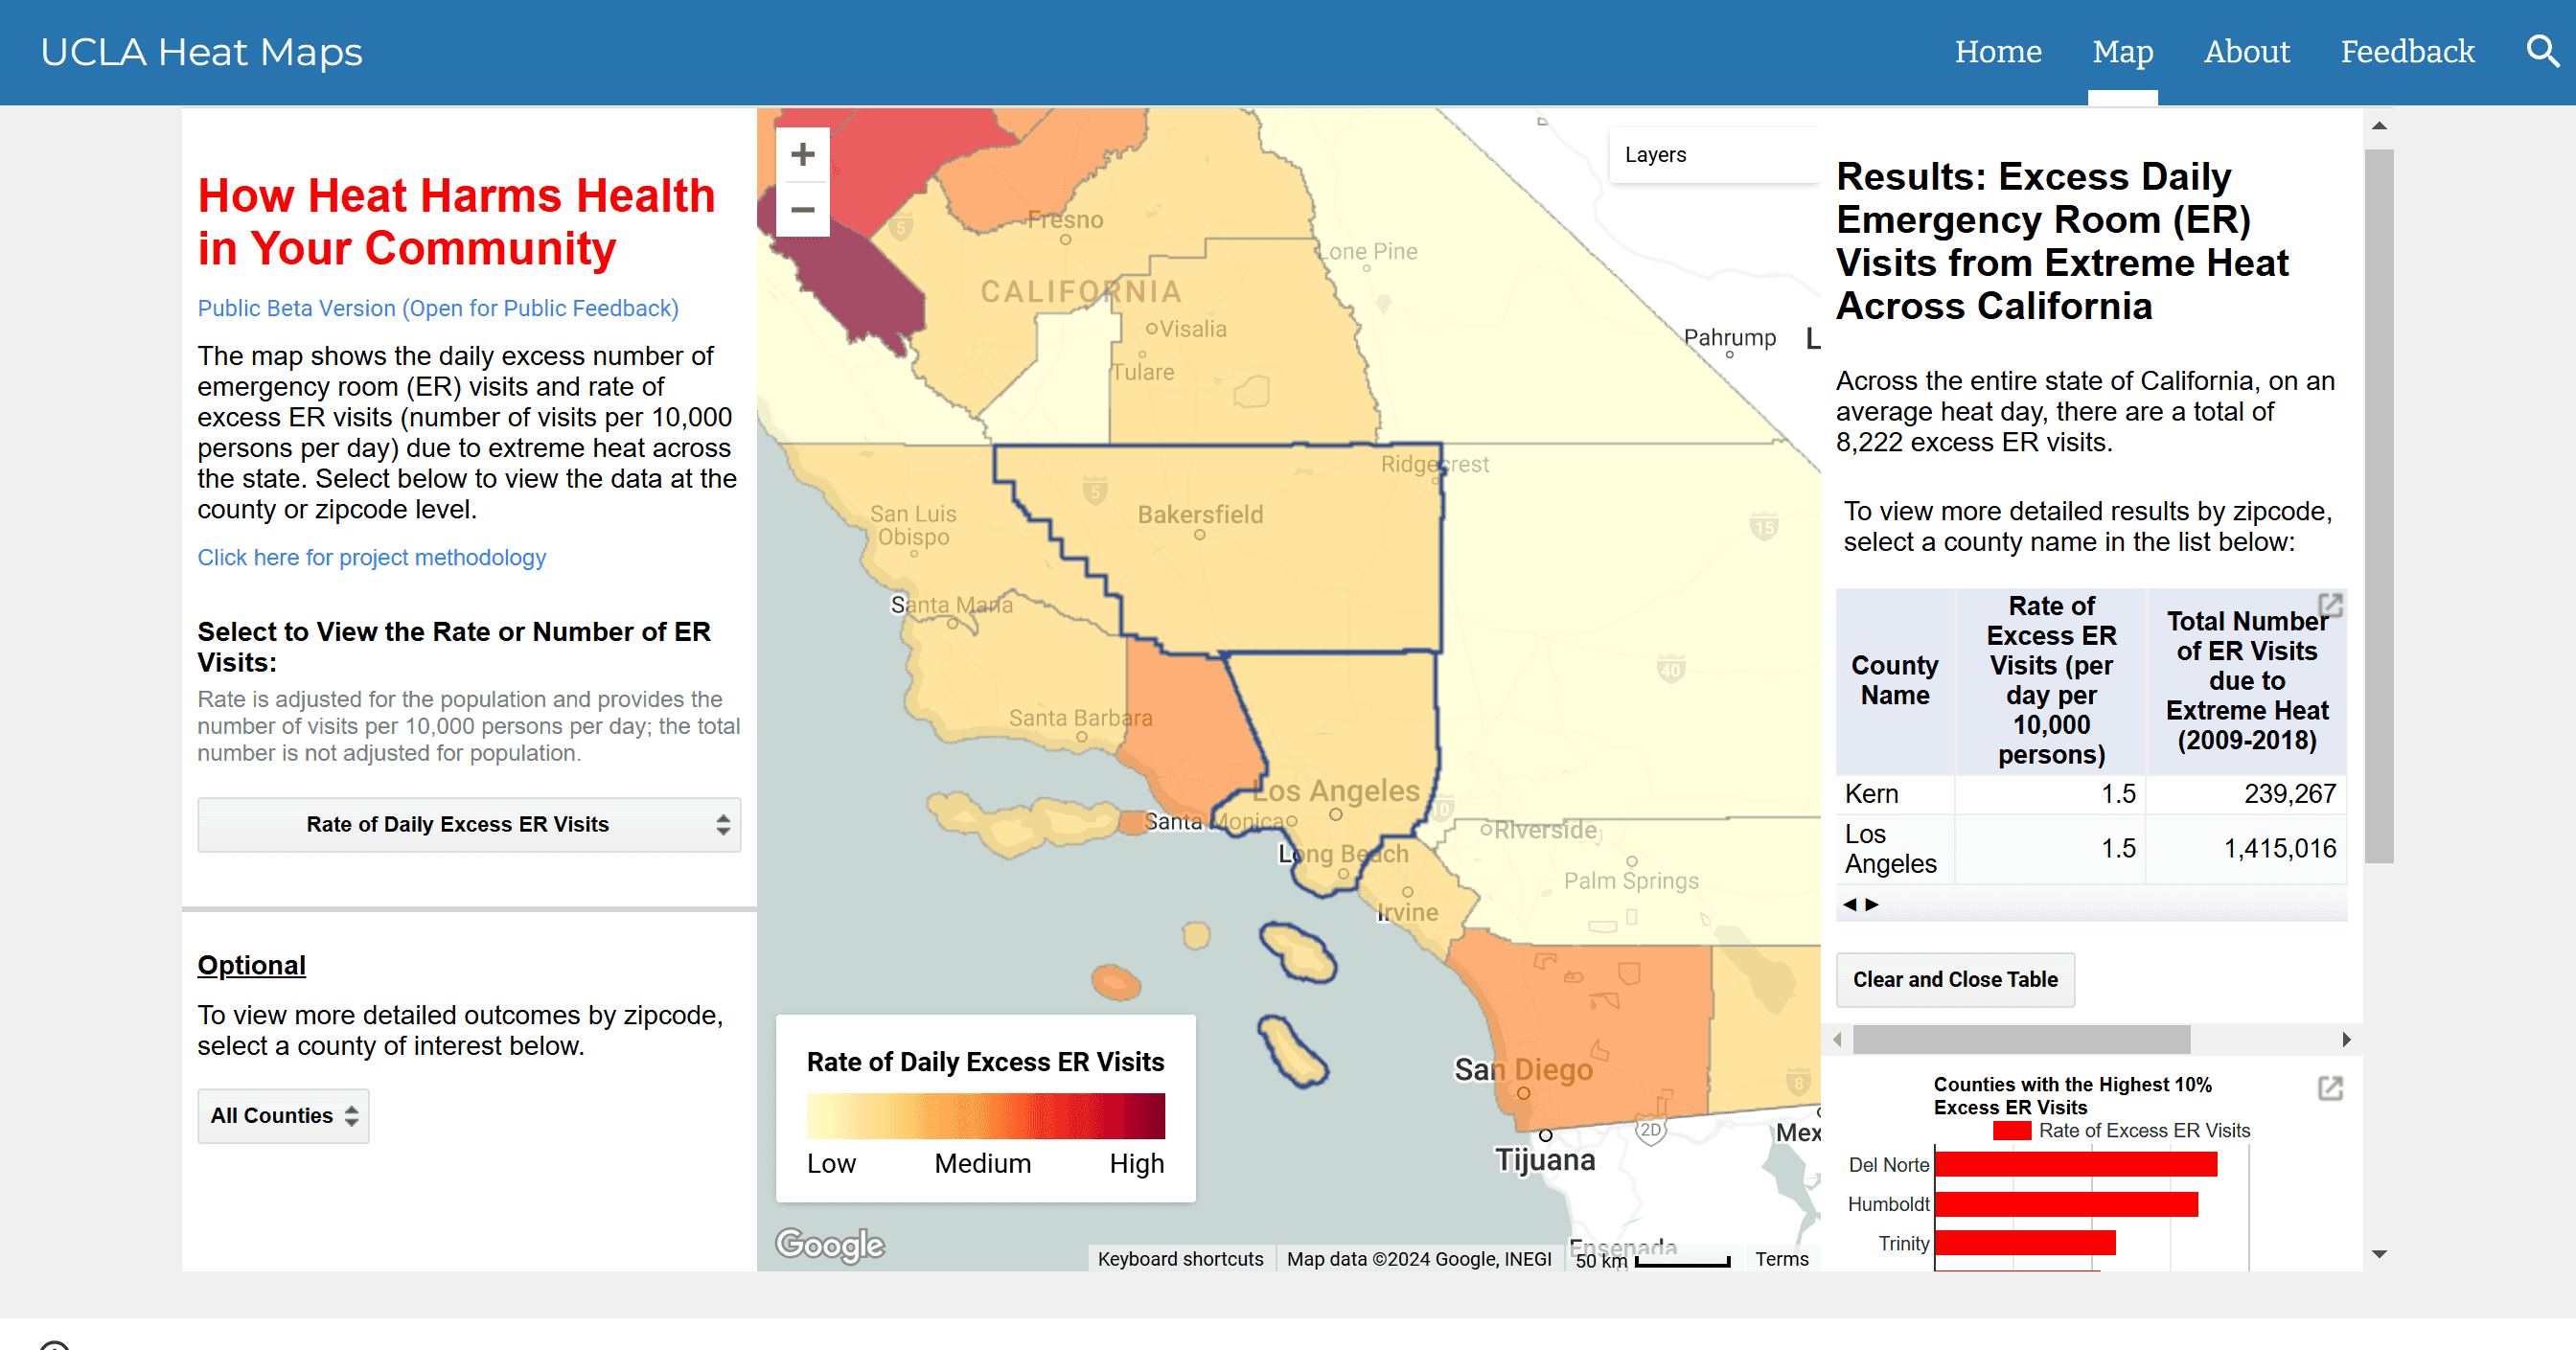
This interactive map of heat-related health outcomes in California shows the excess daily emergency room visits that occur on an extreme heat day compared to the usual, non-extreme heat day. It shows this excess by county and zip code. By using the map, public health professionals, emergency service providers, urban planners, legislators, health and human services providers, non-governmental organizations, and communities themselves can find out which neighborhoods across the state are at greatest risk of harm during extreme heat events.
















Members
Sign in to continue
Sign in to download this file. It's free to register, and we will bring you straight back to this page.
Or continue with email
No account? Register